Dev Tools
Bruno provides built-in Dev Tools to help you debug your APIs, catch bugs, test functionality, and get all essential details related to your API requests. The Dev Tools feature four main tabs:
- Console - For testing, scripting, and debugging
- Network - For analyzing network configurations and performance
- Performance - For monitoring request performance metrics
- Terminal - For executing git commands and terminal operations
The Dev Tools are available in Bruno 2.8.0 or higher versions.
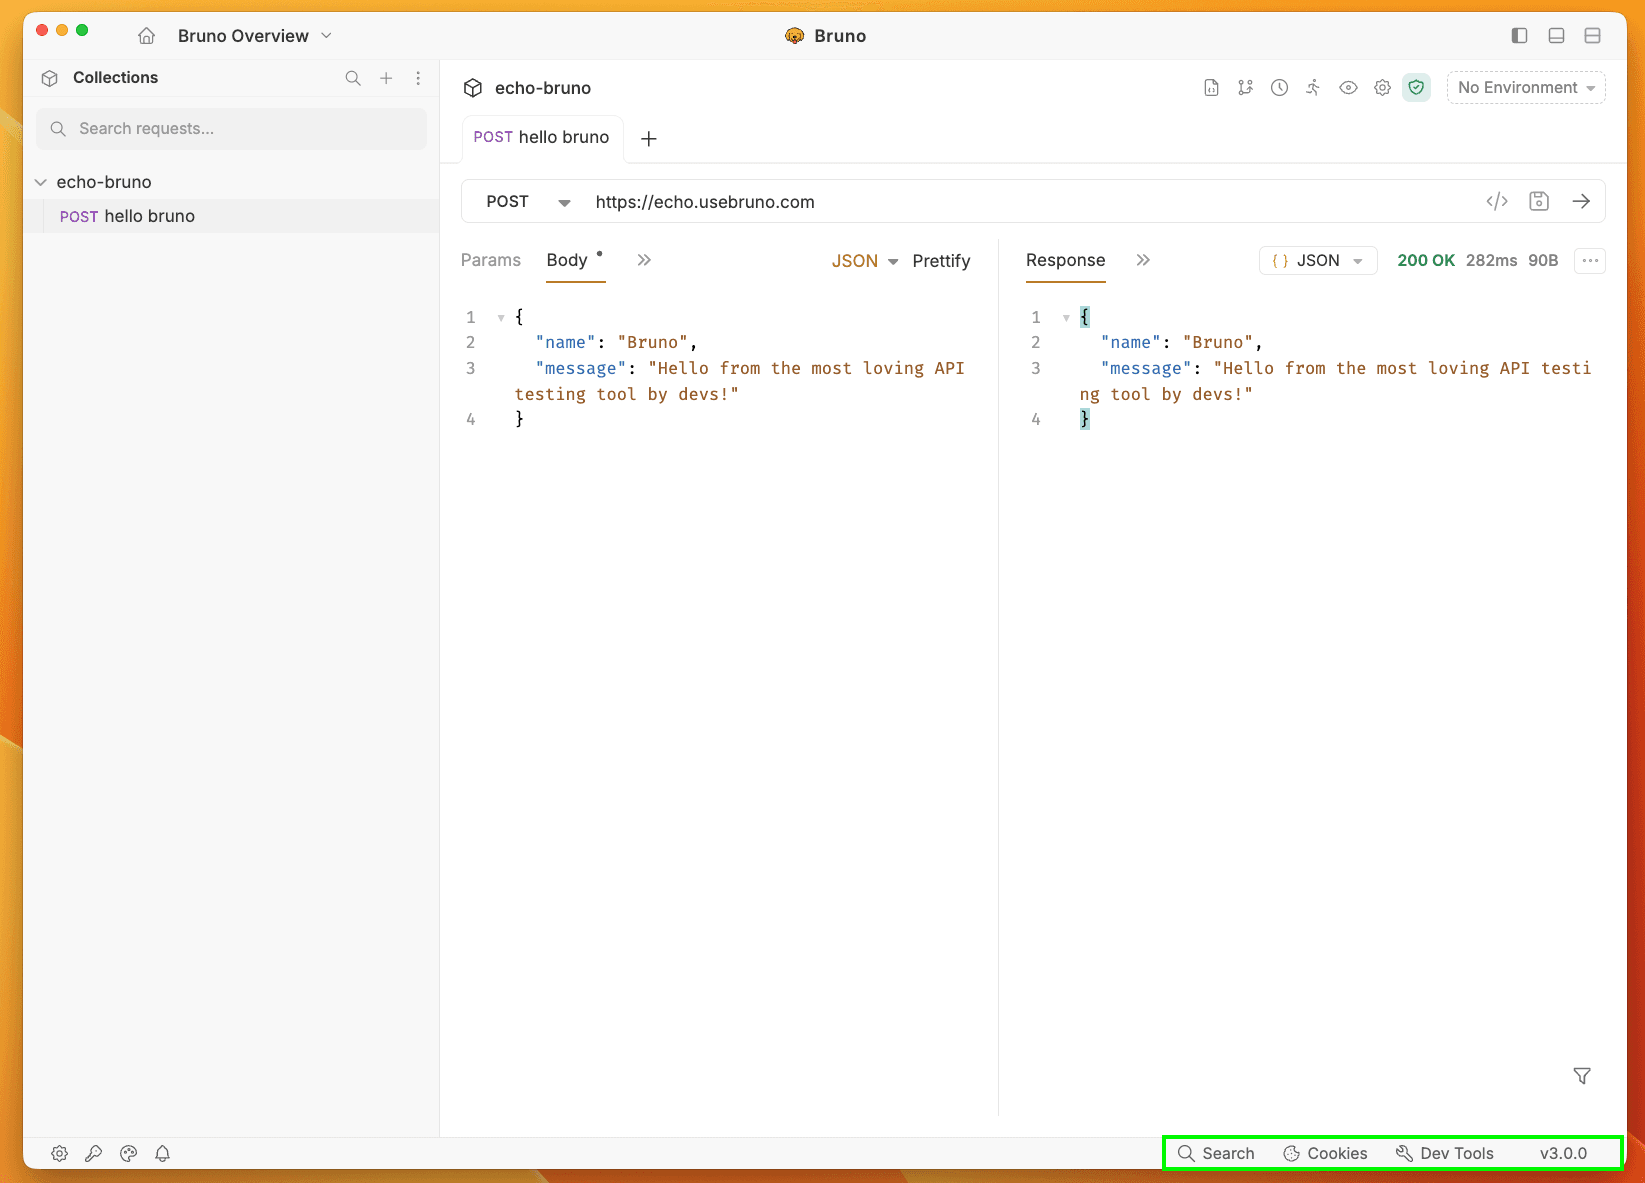
Accessing Dev Tools
The Dev Tools are located in the bottom-right corner of the interface, next to the cookies button. Simply click on the Dev Tools icon to open and start using the debugging features.
Console
The Console tab is your primary debugging companion in Bruno. It provides a powerful environment for:
- Testing and Scripting: Execute JavaScript code and test your API logic
- Debugging: Troubleshoot API issues and scripting problems
- Logging: View console outputs, errors, and debugging information
- Interactive Development: Similar to browser developer tools but customized for Bruno

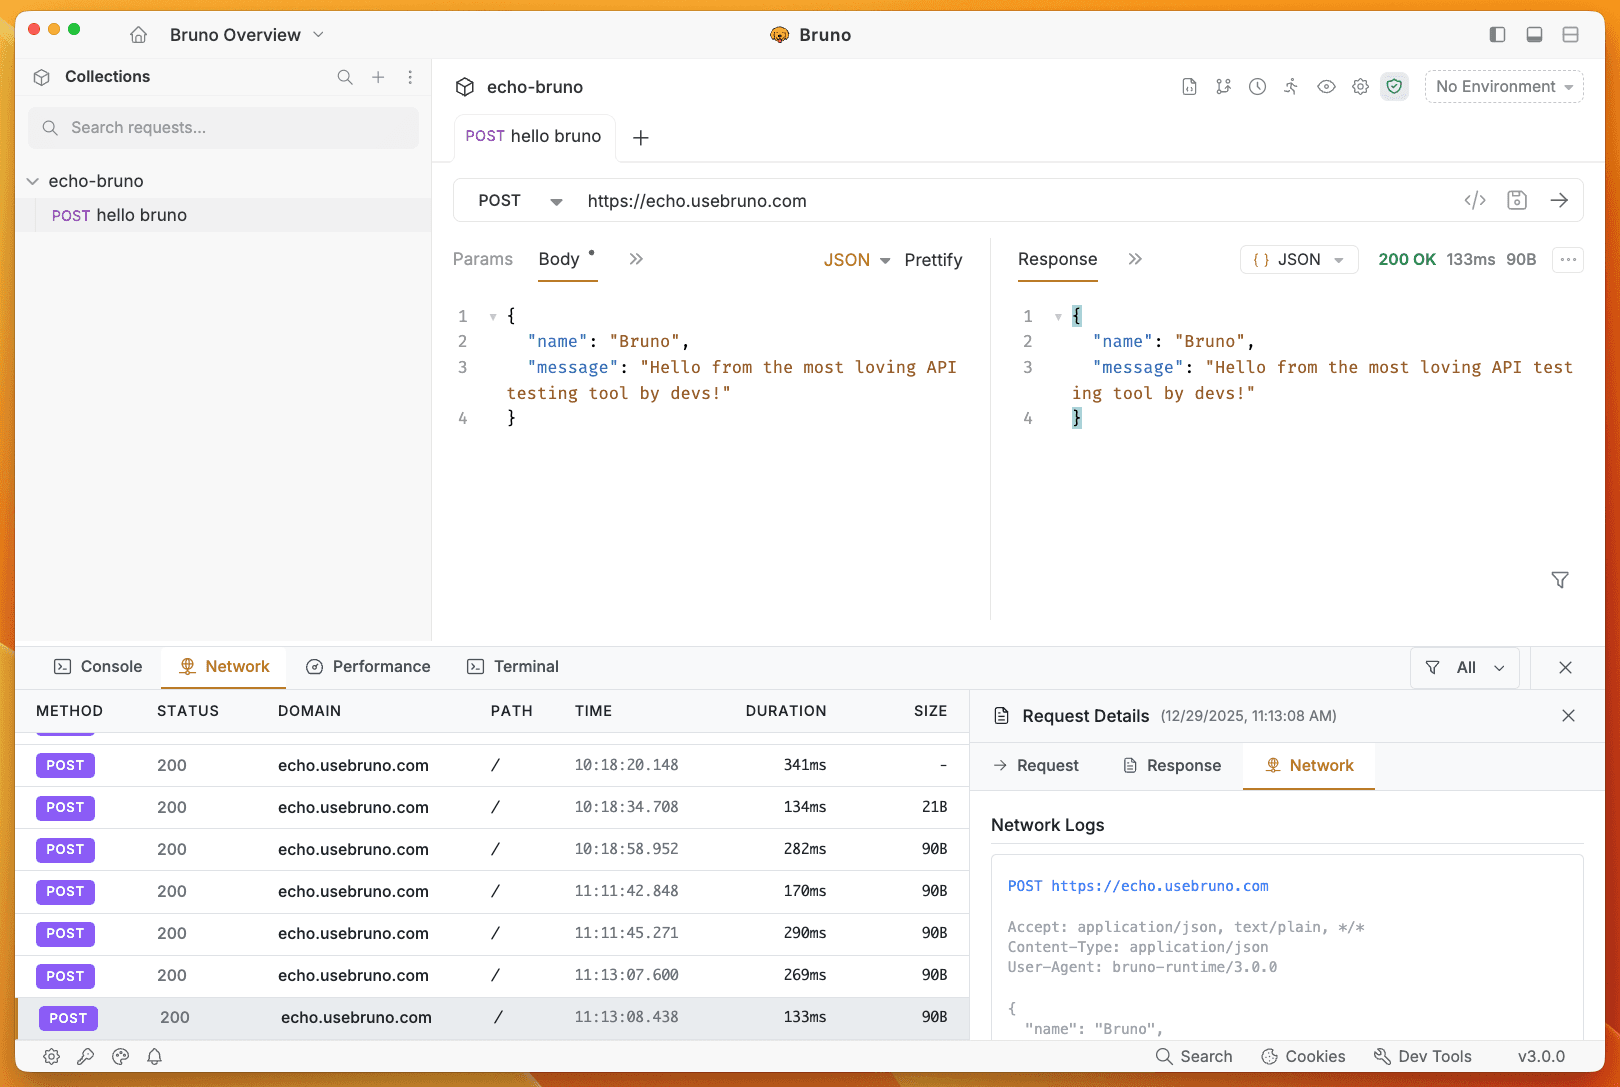
Network
The Network tab provides comprehensive insights into your API requests and responses. It’s essential for:
- Security Validation: Review security headers and authentication details
- Request/Response Inspection: Examine headers, body, and status codes
- Network Configuration: Verify proxy settings and connection details
- Troubleshooting: Identify network-related issues and errors
This tab gives you complete visibility into the network layer of your API interactions, helping you validate response data and understand the full request lifecycle.
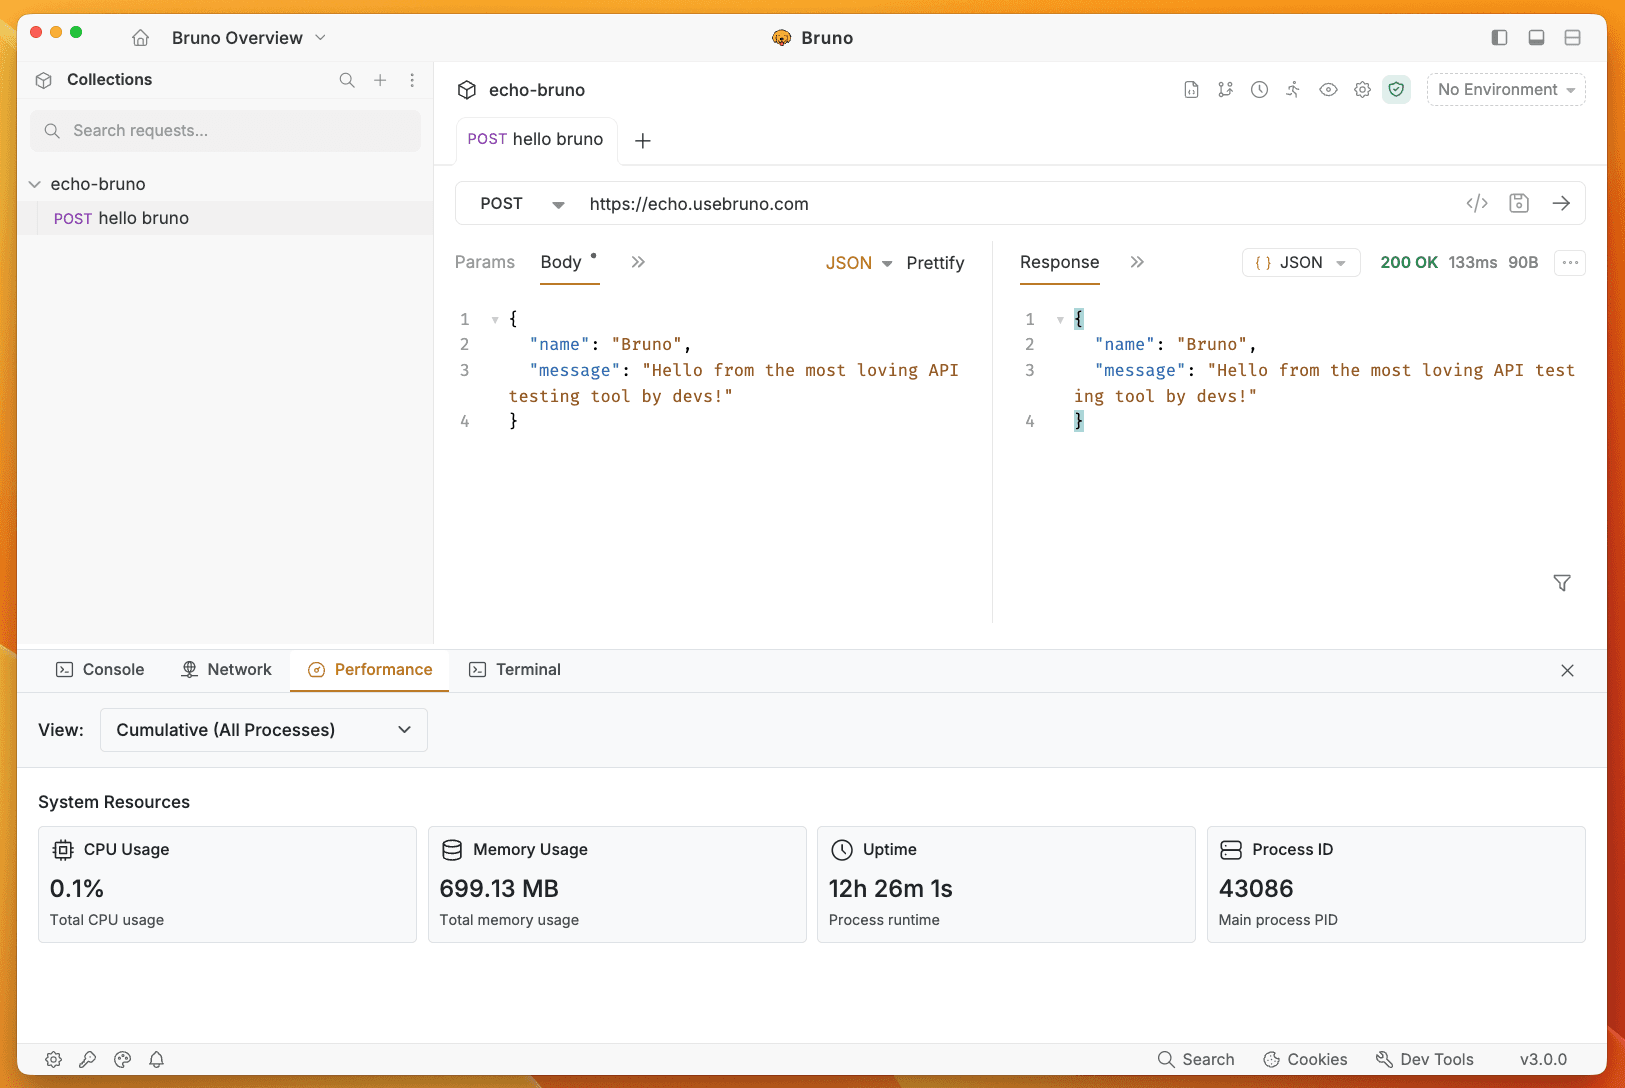
Performance
The Performance tab allows you to monitor Bruno’s application performance and system resource usage. It provides real-time insights into:
- CPU Usage: Monitor current CPU consumption by Bruno
- Memory Usage: Track current memory usage of the application
- Uptime: View how long the Bruno process has been running
- Process ID: Identify the specific process ID for debugging purposes
- Process View: Switch between different process views (Browser, GPU, Utility, Tab)
This tab helps you monitor Bruno’s resource consumption and identify any performance issues with the application itself, ensuring smooth operation during your API development workflow.
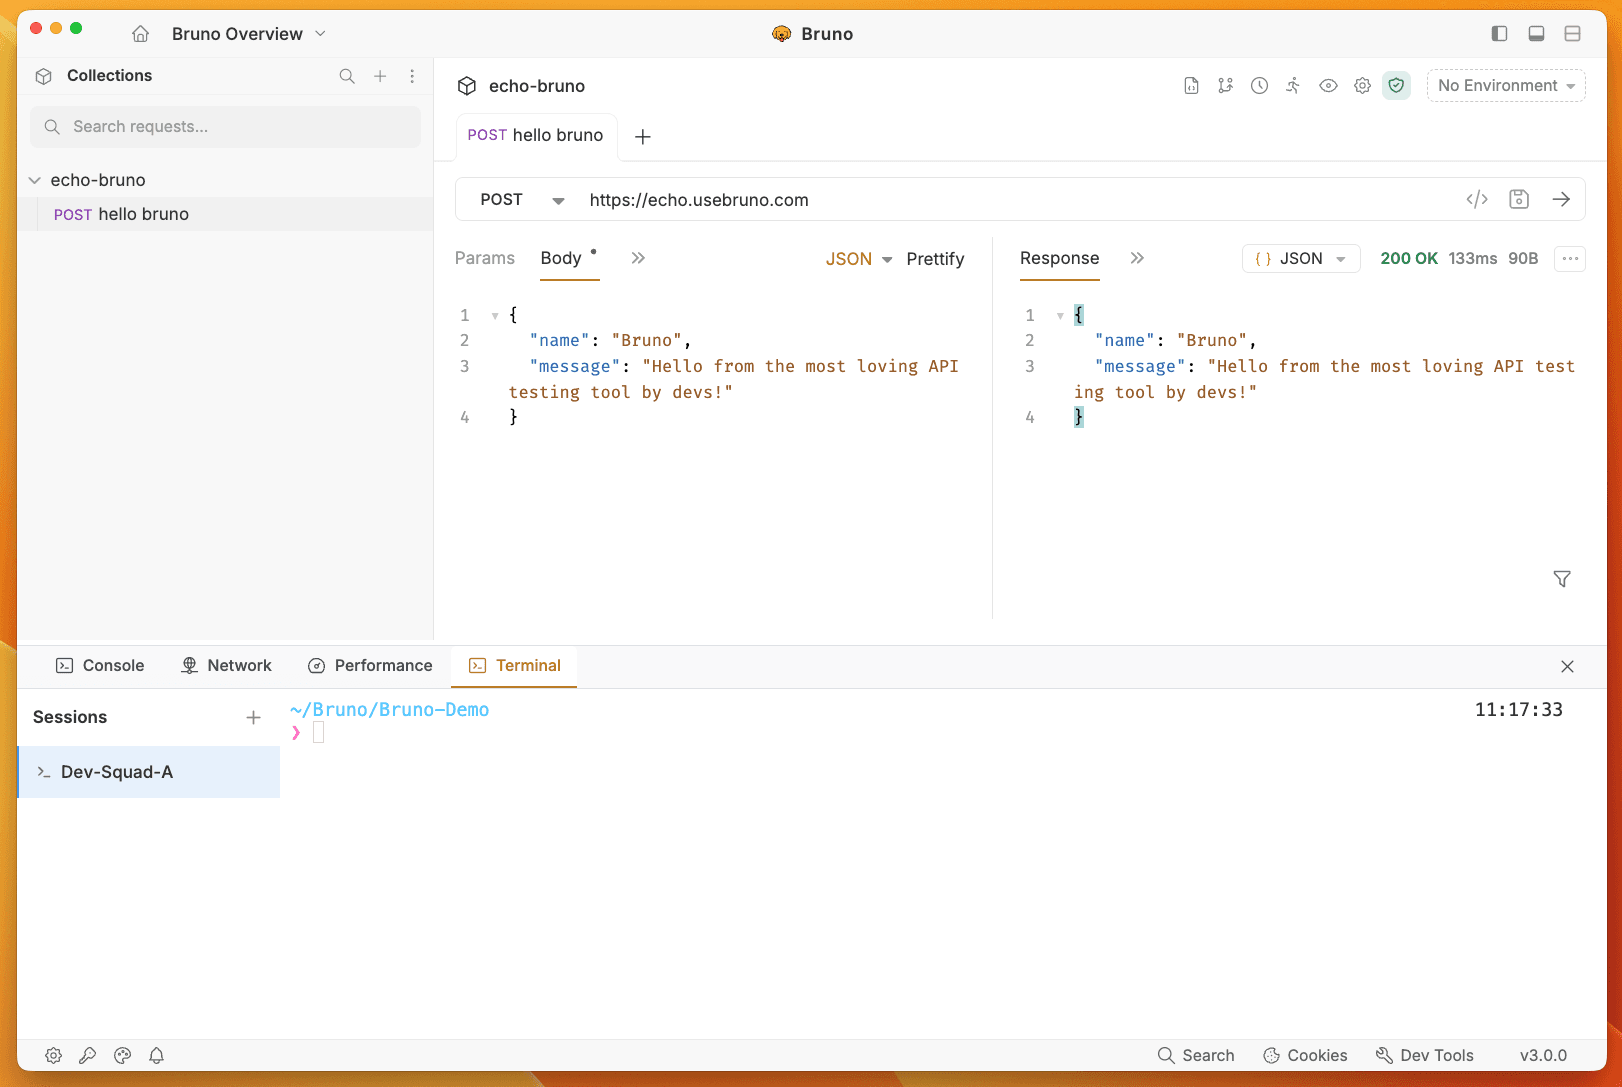
Terminal
The Terminal tab provides a command-line interface within Bruno for executing git commands and terminal operations. It’s useful for:
- Git Operations: Execute git commands directly from Bruno (e.g., git checkout, git branch)
- Version Control: Manage your API collection’s version control without leaving Bruno
- Workflow Integration: Streamline your development workflow by combining API testing with git operations
- Session Management: View and manage multiple terminal sessions
This tab integrates git functionality directly into your development environment, making it easier to manage collections that are version-controlled.